
Technical Scope: The Sideways trading continues
June 4, 2026 at 1:15 PM
Technical Analysis Today: DXY, EUR/USD, GBP/USD & Gold Outlook
Welcome to today’s edition of The Technical Scope, your twice-weekly guide to the evolving landscape of global markets through the lens of technical analysis. This report focuses on pure price action, highlighting key supply and demand zones, tracking momentum shifts, and identifying potential trading opportunities. Each edition covers major assets, offering a broad view of how currencies, commodities, and equities are performing. When market conditions present interesting setups, additional instruments will also be analyzed to provide deeper insight and actionable context.
Today’s edition presents our technical analysis of the following key assets: DXY, EUR/USD, GBP/USD & Gold.
Dollar Index
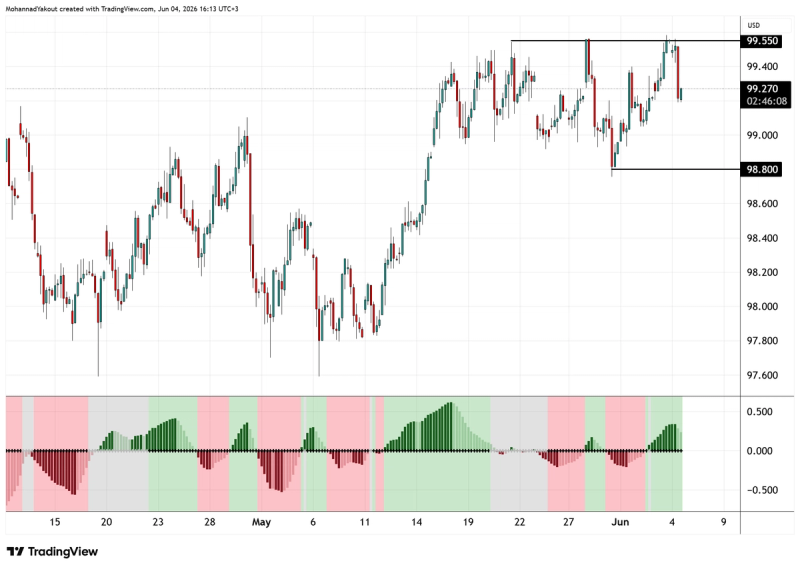
4-Hour Chart
The Dollar Index chart reveals a defined sideways consolidation pattern following its prior impulsive upward expansion. Price action has repeatedly tested the structural ceiling at the 99.550 level, where selling pressure has capped further upside momentum. Currently, the index is oscillating within a clear horizontal range, indicating a temporary equilibrium between buyers and sellers.
Traders should monitor for a continued move lower within this range, targeting the established support floor at 98.800. A failure to defend this lower boundary could signal a deeper corrective phase, whereas a sustained hold above it will keep the broader sideways structure intact.
EUR/USD
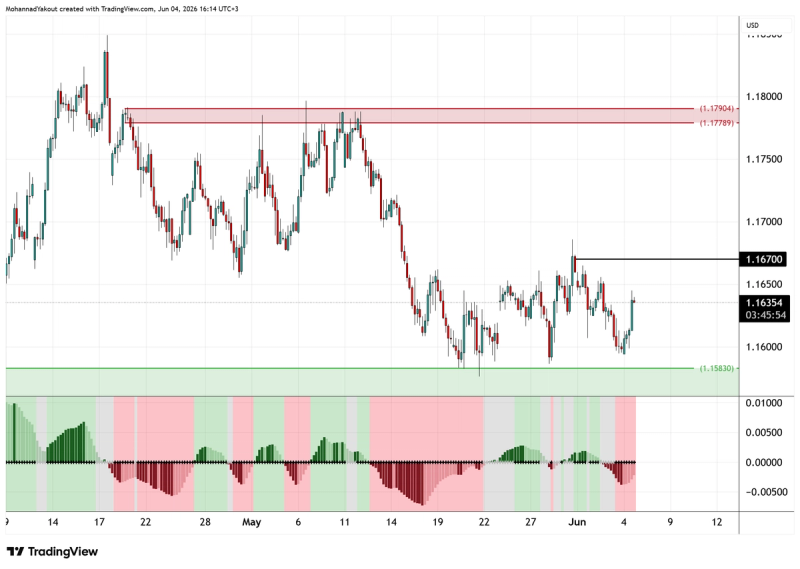
4-Hour Chart
The EURUSD chart shows the pair stabilizing within a multi-week sideways range after finding a cyclical floor near the lower green accumulation zone at 1.15830. Price action is currently consolidating post a recent minor recovery, gathering momentum for a potential continuation higher.
An extension of this short-term bullish rotation is expected to test the immediate horizontal resistance level at 1.16700. A clean breakout and daily close above this 1.16700 ceiling would validate a structural shift, opening the door for an extension toward the upper red supply zones.
GBP/USD
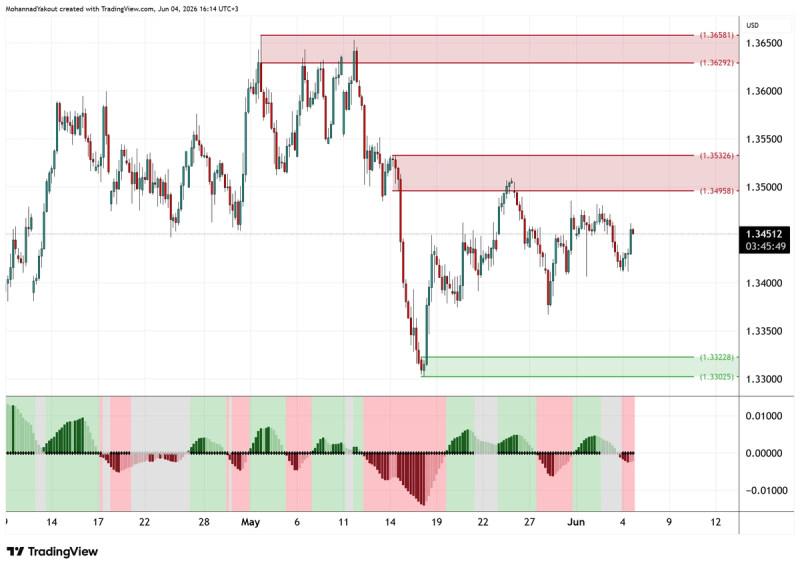
4-Hour Chart
As illustrated in the chart, the GBPUSD pair is displaying signs of a structural bottoming effort after firmly defending the lower green demand zone spanning between 1.33025 and 1.33228. Following this successful test of liquidity, the price action suggests a developing bullish bias with a possible move higher to retest the immediate overhead supply zone.
Traders should closely monitor the red institutional selling block situated around the psychological 1.3500 level. A decisive break through this resistance area is required to shift the short-term market structure from bearish to sustainably bullish.
Gold
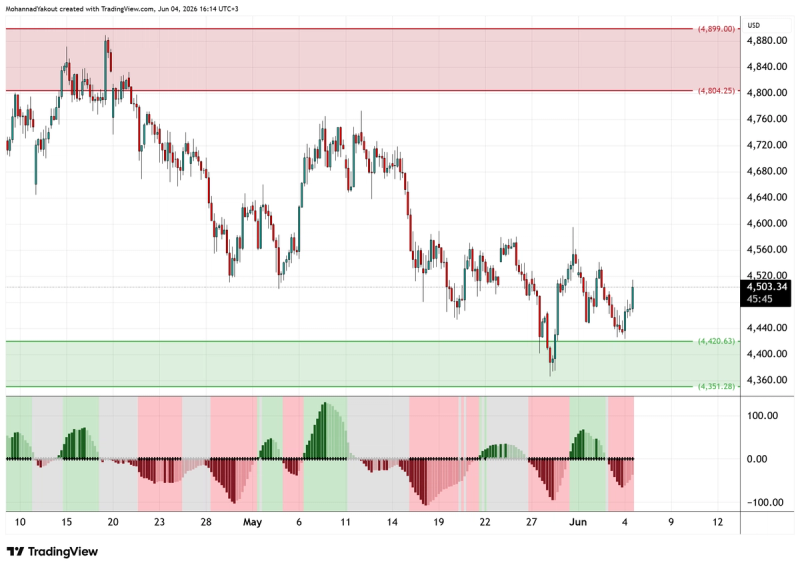
4-Hour Chart
The Gold chart highlights a powerful defensive stand within the lower green demand zone, which sits around $4,420. Having thoroughly swept local liquidity and formed a macro higher-low structure, the precious metal is displaying a strong potential move higher.
If current buying momentum persists and the immediate minor resistance levels are cleared, XAUUSD is technically positioned to launch an extended, impulsive leg upward to challenge the psychological 4,600 structural milestone. A successful expansion toward this level would pave the way for a broader retest of the major red supply zone located above 4,800.
This material is a marketing communication provided for informational purposes only and does not constitute investment advice, recommendation, or an offer or solicitation to trade. Any market analysis, opinions, or forecasts are based on publicly available information and do not constitute independent investment research. Past performance and forecasts are not reliable indicators of future results. Scope Markets accepts no liability for any loss arising from reliance on this information.
Related Articles

Technical Scope: Price Action Ahead of the Peace Summit
By Mohanad Yakout
Welcome to today’s edition of The Technical Scope, your twice-weekly guide to the evolving landscape of global markets through the lens of technical a...
Read More
Market Analysis
Price Action
Swing Trading
Technical Analysis
Technical Scope: No changes in technicals, or fundamentals!
By Mohanad Yakout
Welcome to today’s edition of The Technical Scope, your twice-weekly guide to the evolving landscape of global markets through the lens of technical a...
Read More
Market Analysis
Technical Analysis
Swing Trading

Technical Scope: The Strong Dollar Effect
By Mohanad Yakout
Welcome to today’s edition of The Technical Scope, your twice-weekly guide to the evolving landscape of global markets through the lens of technical a...
Read More
Market Analysis
Technical Analysis

Technical Scope: Markets stuck in a sideways range
By Mohanad Yakout
Welcome to today’s edition of The Technical Scope, your twice-weekly guide to the evolving landscape of global markets through the lens of technical a...
Read More
Market Analysis
XAUUSD
USDJPY
US 500
Trend Following
Technical Analysis
Swing Trading
Support And Resistance

Stop Trading the News, Start Trading the Oil Cargo
By Victor Golovtchenko
When you see a Reuters headline that tells you OPEC+ is "completing the series of symbolic quota hikes," what exactly are you trading? When the Irania...
Read More
Market Analysis
Oil
US Oil
UK oil
WTI
Brent Crude
Trading

Technical Scope: Markets Mixed Ahead of Key Developments
By Mohanad Yakout
Welcome to today’s edition of The Technical Scope, your twice-weekly guide to the evolving landscape of global markets through the lens of technical a...
Read More
Market Analysis
XAUUSD
USDJPY
US 500
Trend Following
Technical Analysis
Swing Trading
Support And Resistance
Technical Scope: Key Levels & Market Outlook ahead of NFP Data
By Mohanad Yakout
Welcome to today’s edition of The Technical Scope, your twice-weekly guide to the evolving landscape of global markets through the lens of technical a...
Read More
Market Analysis
Chart Patterns
Candlestick Patterns
Day Trading
GBPUSD
Gold
NFP
Non Farm Payrolls
EURUSD
Oil
S&P 500
US 500
USDJPY
XAUUSD
The state of Hormuz: oil price action is not the story
By Victor Golovtchenko
Another month, another week, another batch of headlines, and new all-time highs for US stock markets might not be the news one awaits when they see th...
Read More
Market Analysis
Oil
WTI
Brent Crude
Strait of Hormuz
UAE
OPEC
Technical Scope: Key levels to watch for on JPY pairs
By Mohanad Yakout
Welcome to today’s edition of The Technical Scope, your twice-weekly guide to the evolving landscape of global markets through the lens of technical a...
Read More
Market Analysis
Technical Analysis
Day Trading
Chart Patterns
EURUSD
GBPUSD
Crude Oil
S&P 500
Gold

Beyond oil & gold: sector rotation from AI-centric to energy-centric
By Victor Golovtchenko
The vulnerability of the Strait of Hormuz which is handling 20% of global oil flows and a massive share of Qatar’s liquified natural gas (LNG) exports...
Read More
Market Analysis
Stocks
Energy
Tesla